
How do you draw graphs?
"How do you actually draw the graph of a function?" Is the question that some students ask themselves in math class. You have to proceed differently depending on the type of function.
What you need:
- pencil
- ruler
- calculator
This is how you draw a straight line
- The function of a straight line generally has the form f (x) = mx + n. The y-intercept of the function is therefore n. This gives us the point P (0 / n). The slope of the function is m.
- When you have drawn a coordinate system with the x and y axes, plot the y-axis intercept n.
- From this point P (0 / n) you can construct the straight line with the help of a slope triangle. For the slope triangle, go one unit to the right and m units up. Sometimes m is negative. Then go one unit to the right and the negative value in the negative direction of the y-axis intercept, i.e. downwards.
- There is a second point on the straight line. Now draw a line through the two points to get the graph of the function.
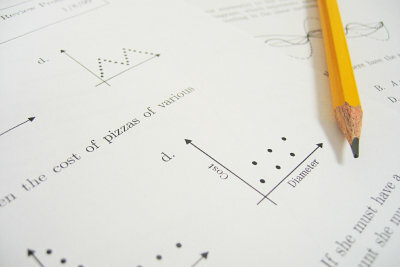
Draw the graph of a function with a table of values
- Create a table of values for the function. Normally, the y-values for the x = -5, -4, -3, -2, -1, 0, 1, 2, 3, 4 and 5 are sufficient.
- First substitute -5 for x in the function of the graph to get the corresponding y-value.
- Next, substitute -4 for x in the function to get the corresponding y-value here as well.
- Repeat the process again and again with the other x-values until you have calculated the corresponding y-value for all x-values.
- The points obtained are now entered in a coordinate system.
- A straight line is drawn by connecting the points with a ruler.
- If you don't have a straight line, you need to connect the dots freehand to get the graph.
How do you draw a hyperbola?
Are you currently busy drawing various functions? Then ...
How to draw a function with a curve discussion
- Determine the y-axis intercept with the condition x = 0.
- Calculate the zeros using the condition y = 0. It may be necessary to use the p-q formula or a polynomial division to calculate the x values.
- Determine the extreme points using the conditions f '(x) = 0. If f '' (x) is less than zero, it is a local maximum. If f '' (x) is greater than zero, there is a local minimum. If f '' (x) is equal to zero, there is a saddle point.
- Finally, you should determine the inflection points of the function with the conditions f '' (x) = 0. The sufficient criterion for a turning point is f (x) is not equal to zero.
- Enter all these points in a coordinate system.
- Connect these points freely by hand so that you get the graph of the function.
How helpful do you find this article?